

We got a number of great follow-up questions from our most recent post about tax rates and revenues.
Most of those questions were helpful in teaching us somewhat decisively just how complicated understanding tax policy really is. In this post, we’ll share some of those questions (and their implications), and attempt to answer a few.
- “What does average mean in this case? Is it weighted?” Great question. The answer there is no, which means the change in relative tax bracket income really matters here.
- “Doesn’t the laffer curve look specifically at total tax revenues? If higher taxes were holding back the economy, then we’d see it in absolute rates rather than as % of GDP.” Absolutely. That means we need to look elsewhere: if average tax rates are rising but revenue is staying the same, then something else must be changing that we can find.
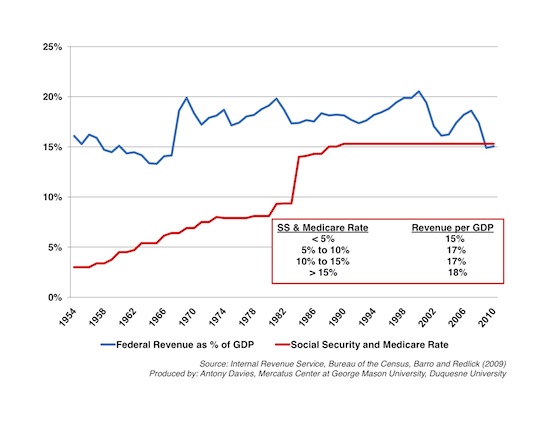
- “Do these federal revenues contain more than just income taxes?” Yes–so we know, for example, that payroll taxes (medicare, medicaid, social security) have gone up a lot:
- “The rich pay the bulk of the taxes–what about them?” So first, we see that the marginal top tax rate has plummeted–from 90% to 35%… with almost no change in the revenues.

What might be driving that?
One clue is to look at the share of the tax burden by income group:

This gap shrinks when we include payroll taxes, which are flat rather than progressive. But what we’re seeing is a shift towards the rich paying more federal taxes.
Part of what explains this is that the rich are getting richer.

So while the marginal tax rates on that highest earners has dropped, the earnings have increased, which means we’re more likely to see something closer to “flat” income being brought in. Given that this group pays most taxes, it’s going to have a disproportionate impact on the total revenues.
But it doesn’t explain the whole picture. Between 1990 and 2010 (a period with historically steady growth of the top bracket’s income), the top marginal rate moved from 30% to 40% and then back down to 35%, but revenues barely budged. Where can we look to understand what changed during that period to offset those predicted effects? And why are tax revenues so persistently flat when we see much larger changes in that top tax bracket, like the drop from 70% to 30% over fewer than 10 years?
In this case I promise we’re not sitting on an answer: it’s a great question and worth close consideration. We’d definitely appreciate anyone’s input on where to hunt next–leave an idea in the comments below!
41 Comments